
Math in… Fraud Detection
Data skewing one way or the other can be the difference between a business surviving a financial audit or a new medicine making it to market. Because of this, people can feel pressure to nudge or even completely fabricate data get the results they wanted.
The field of identifying this sort suspicious activity is called fraud detection.
When looking for fraud in data, the goal is to find things that “stick out.” For example, if your bank is looking at your purchases at brick and mortar store and sees that all of them were made in Seattle except for two recent purchases in Boston, this would raise some questions. They might call to ask if those were actually your purchases. Or they might see that you recently purchased a plane ticket to Boston, deciding your out-of-state shopping is no longer suspicious.
What “sticking out” might mean depends on the data, so knowing things about how the data was collected and what it represents is always helpful.

Many things we measure follow distribution patterns. For example, human heights tend to follow a normal distribution. This means that if you were to make a frequency graph of all height measurements taken at a doctor’s office in the past year, the result should look roughly like a bell curve.
If the frequency graph doesn’t follow a normal distribution, there could be something special about the data. Maybe half the heights are from adults and the other half from toddlers, for example, which could result in a bimodal distribution curve with two humps instead of one hump.
In the absence of other explanations, however, getting something other than a bell curve could be a sign of data manipulation.
When looking at his book of logarithm tables in 1881, astronomer Simon Newcomb noticed that certain pages were much more worn from use than others. The inputs with small first digits tended to get revisited far more often than those with large first digits. Newcomb hypothesized that in many data sets, the fraction of numbers starting with digit d is about

which works out to the distribution
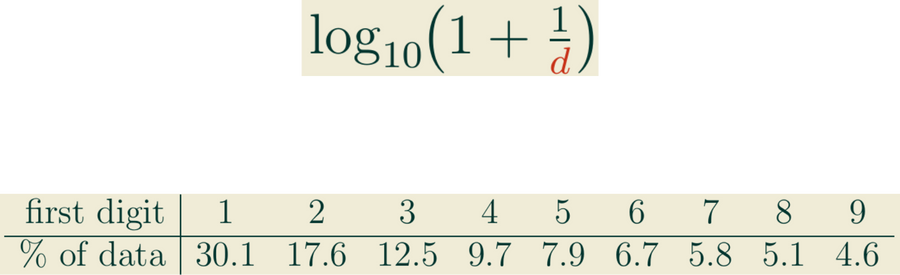
In 1938, physicist Frank Benford rediscovered this phenomenon, testing and confirming it on a variety of different data sets. Many heuristics were given for the law, but Ted Hill finally gave a statistical derivation of it in 1995. Today, this “first-digit rule” is known as Benford’s law.
Human heights measured in feet start with 5 far more often than 1, so Benford’s law can’t be applied to every data set. It tends to work best when data entries range over several orders of magnitude. When applied carefully, however, enough data distributions follow Benford’s law that it is a useful tool for detecting data anomalies.