
Math in… Balloons
Have you ever noticed that the hardest part of blowing up a balloon is at the beginning?

Image: Derrick Coetzee (via Wikimedia)
As you inflate a balloon, the air you add either needs to increase in volume or increase in pressure. Latex and other rubbers are made of polymer chains that stretch under force, so while a more rigid mylar balloon would have to see an increase in pressure, a rubber balloon will expand in a way that balances the forces on the balloon. The air pressure inside the balloon will be higher than the pressure outside the balloon, since the air inside the balloon has the contraction of the balloon (elastic pressure) working against it as the rubber would otherwise return to an unstretched — or, at least, less stretched — state.
A number of scientists have given derivations of the relationship between the pressure inside a rubber balloon and its radius based on models of rubber elasticity, including Ryogo Kubo in 1949, Richard S. Stein in 1958, and David Merritt and Fred Weinhaus in 1978. In their models, the relationship boils down to

The symbol ∝ means “is proportional to,” i.e., the left side equals the right side after multiplication by some positive number. As for the other pieces:
P is pressure
r is the current radius of the balloon
r₀ is the radius of the balloon before inflation
Since the constant of proportionality would only scale the height of a graph, it’s instructive to graph this proportionality relationship as an equation:
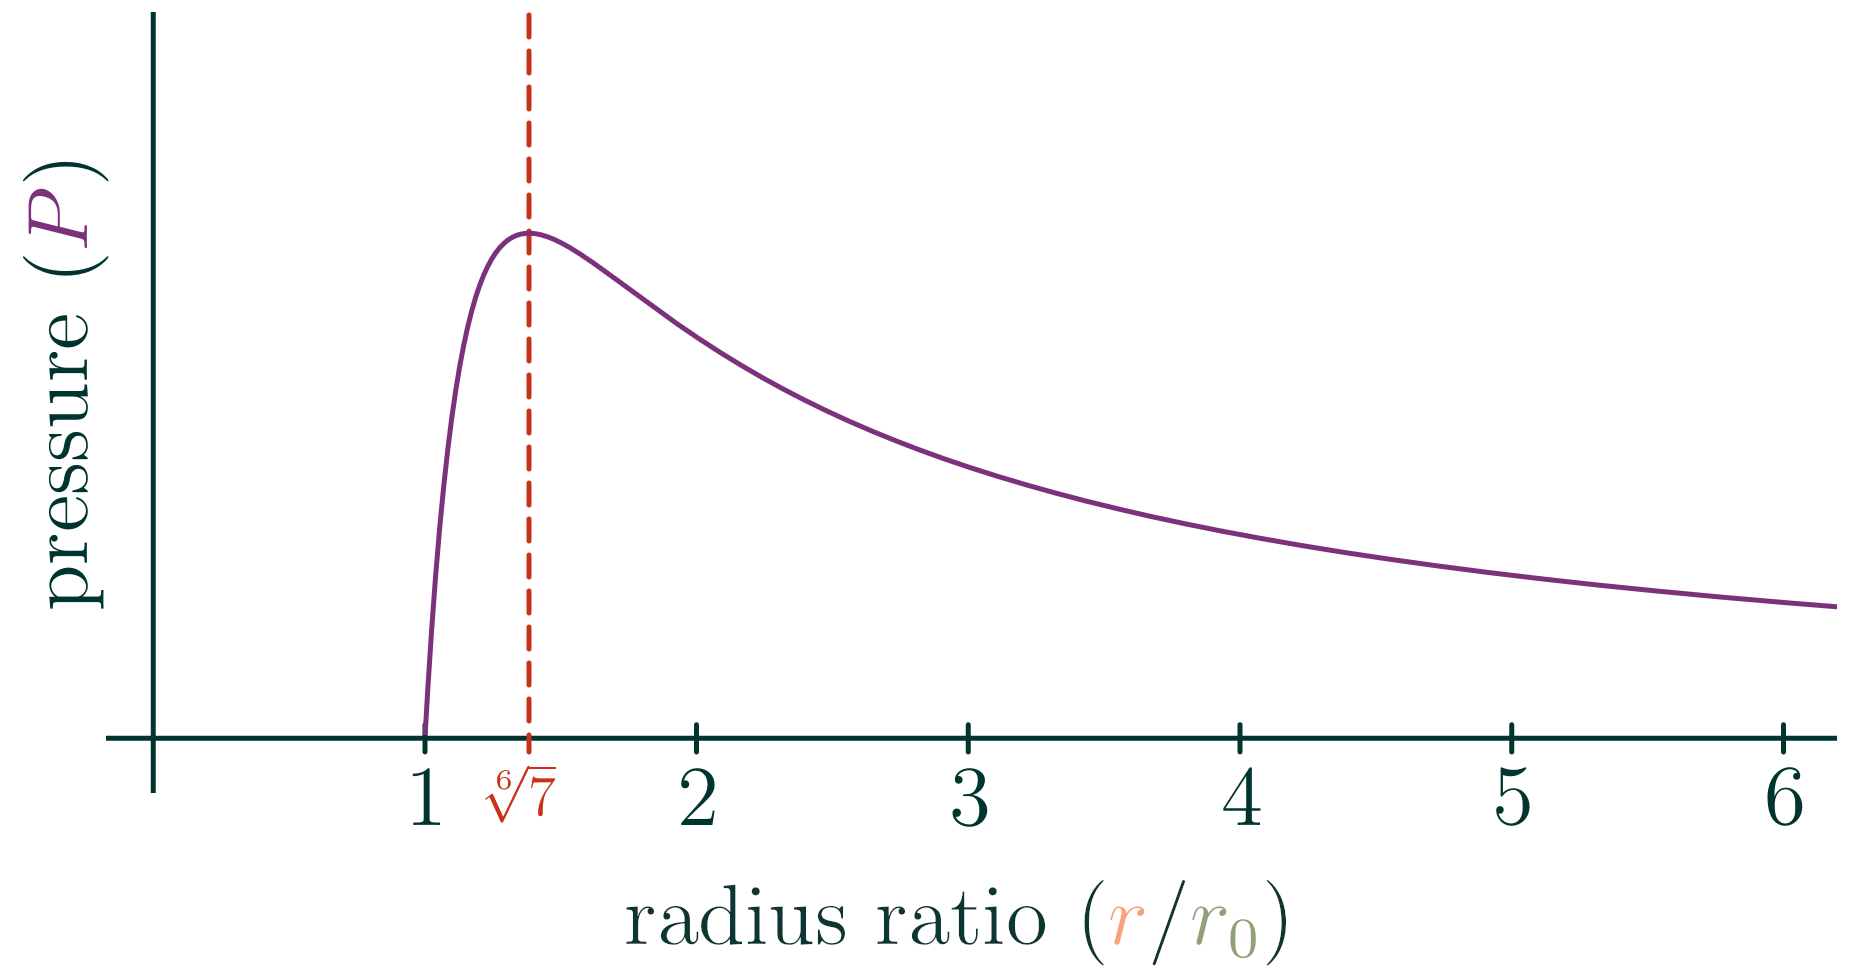
We see that the pressure increases with the radius until the curve peaks. Then the pressure starts decreasing as the radius grows beyond that point. If you know a little calculus, you can find the exact radius at which that maximum pressure occurs:
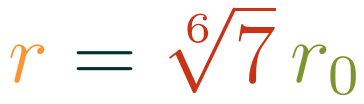
In other words, the pressure is maximal when the balloon’s radius reaches about 1.38 times its radius prior to inflation. Up until this point, it steadily requires more force to blow up a balloon. After that point, less force is required to keep inflating.
Experimental data agrees with this model up to a point. Here’s the theoretical curve compared to experimental data from Richard S. Stein’s paper:

Pressure vs radius ratio (Image: Richard S. Stein, On the Inflating of Balloons)
The data has a peak, just as predicted. However, the pressure begins to rise again after an initial decline. The elasticity model of rubber only models the situation well in a small window, since polymer chains eventually stretch to a point where any further stretching breaks them. At that threshold, pressure builds until chains break and the balloon stiffens and pops, as you may have accidentally discovered by over-inflating a balloon!
There are some other quirks with the model based on elastic hysteresis — materials like rubber have a sort of “memory” for whether they have been stretched because energy is lost due to friction in the stretching. To see how counterintuitive this can be, check out this demo on the two-balloon experiment by The Action Lab:
What other math can you find in balloons?