
Math in… Groundhog Day
According to folklore, if a groundhog leaves its burrow after hibernation and sees its shadow, then it will return home and prepare for a long winter. Otherwise, spring will come early.
The holiday comes to us by way of German-speaking immigrants in Pennsylvania adapting their Dachstag (Badger Day).
You'd be right to question the rigor of Groundhog Day prognostication! Here are a few concerns:
The tradition has used other animals like bears, badgers, and hedgehogs.
The date of the spring equinox has drifted over the years relative to the date of the tradition, which was at some point tied to Candlemas.
The number of extra weeks of winter said to be predicted has varied from four to six.
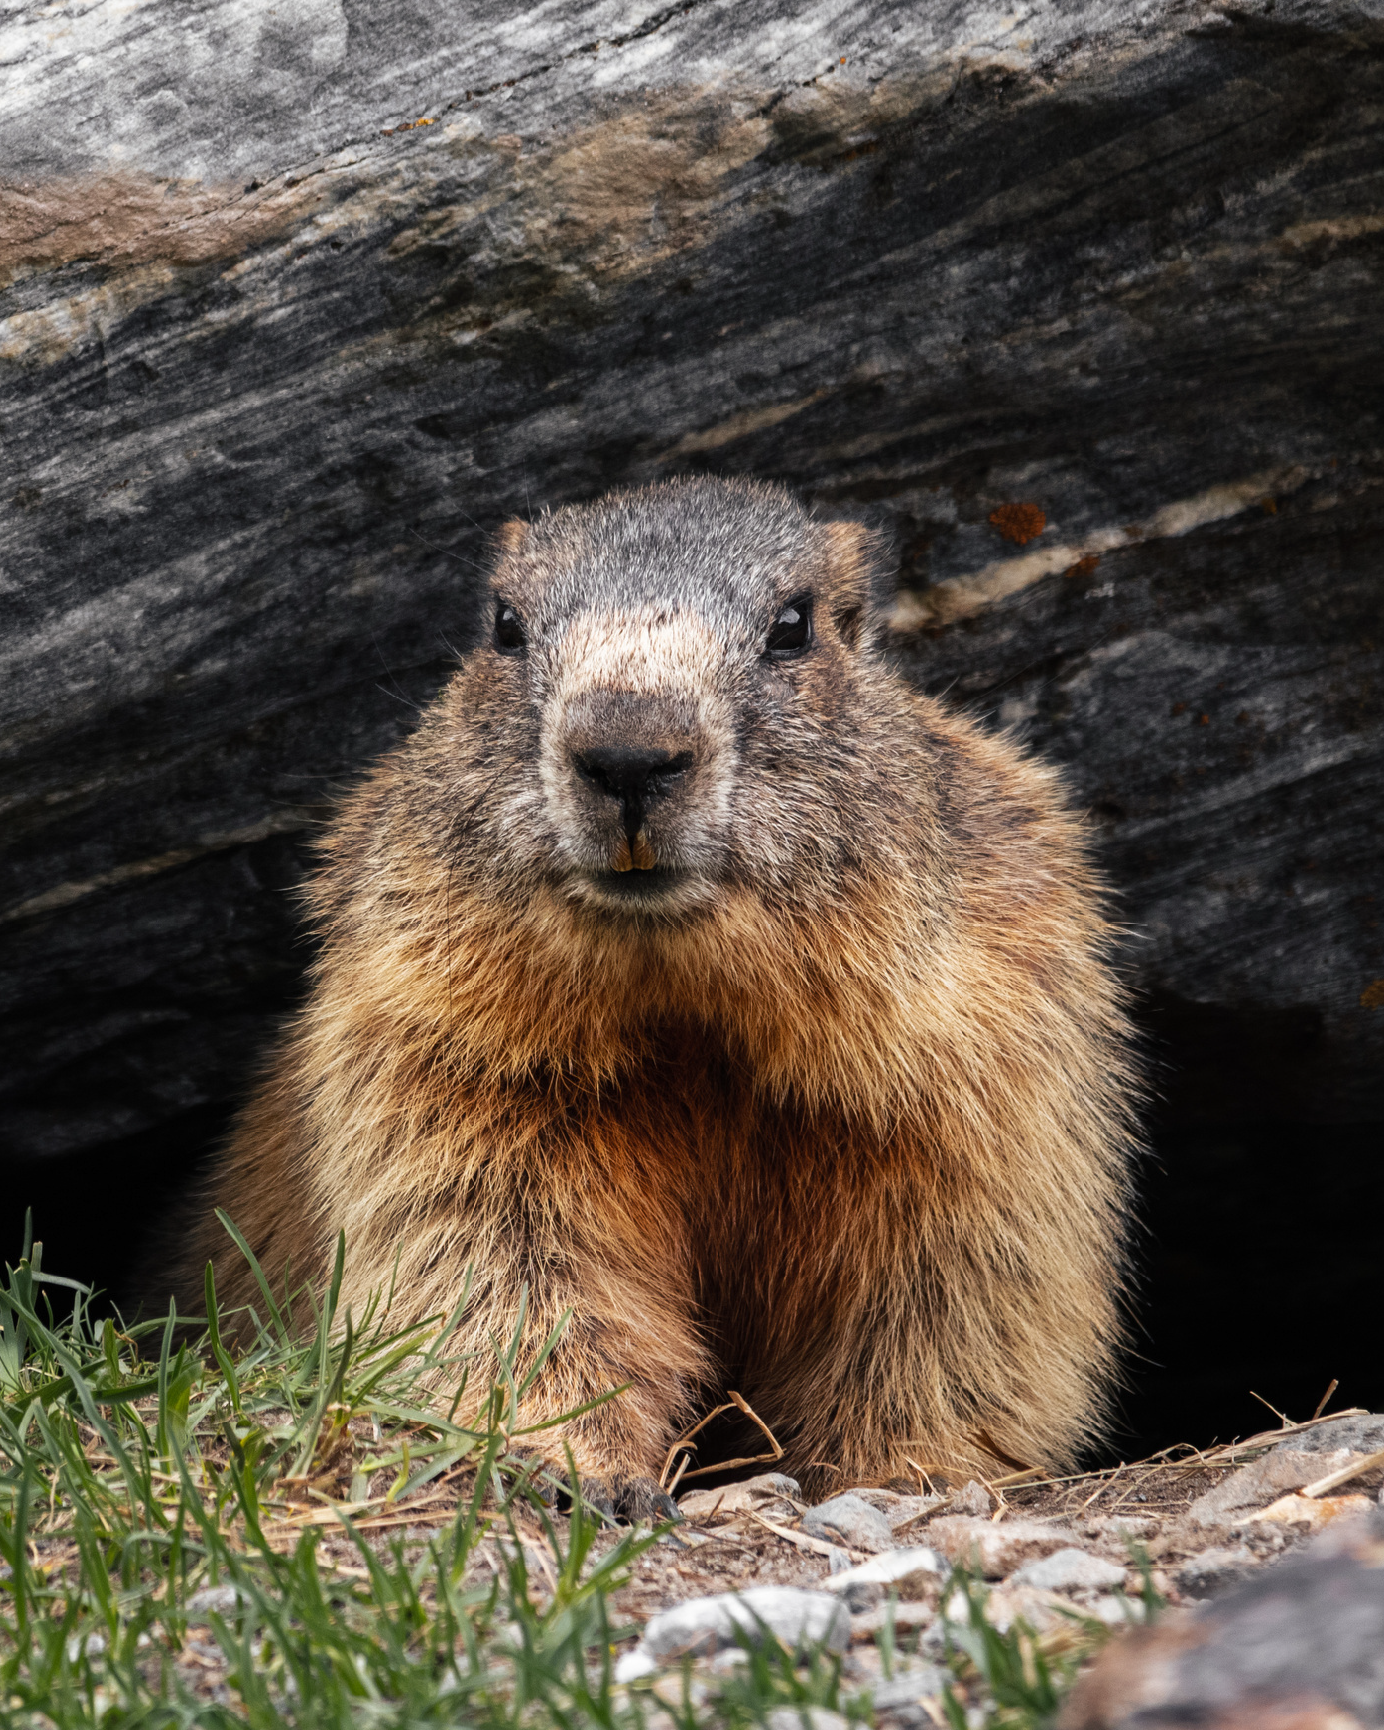
Still, it's a fun tradition and many American towns have celebrity groundhogs or other critters that attempt to predict the remaining winter days.
In 2025, the National Oceanic and Atmospheric Administration (NOAA) pitted their data on average March temperatures against the track records of 19 generalized groundhogs with 20 or more recent predictions on record:
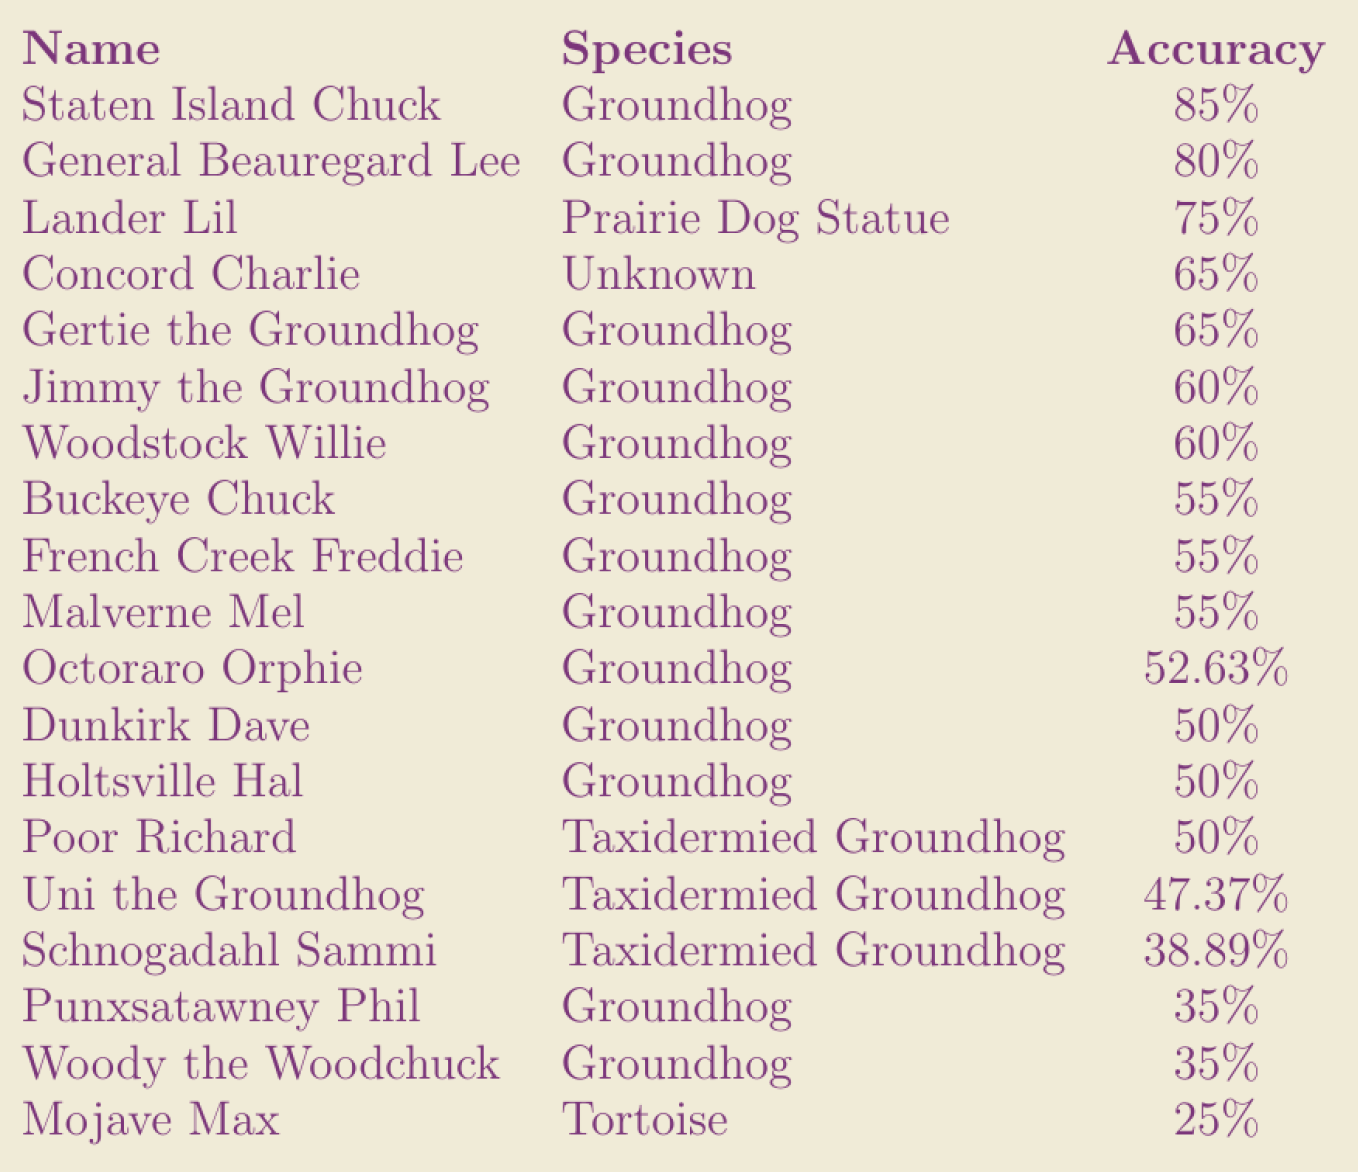
Table adapted from noaa.gov/heritage/stories/grading-groundhogs
Is Staten Island Chuck just that good? Should Woody the Woodchuck hang it up?
Before we draw any hasty conclusions, here's something to consider: I ran a simulation flipping 19 coins 20 times apiece. The statistics on flipping heads are shown on the right.
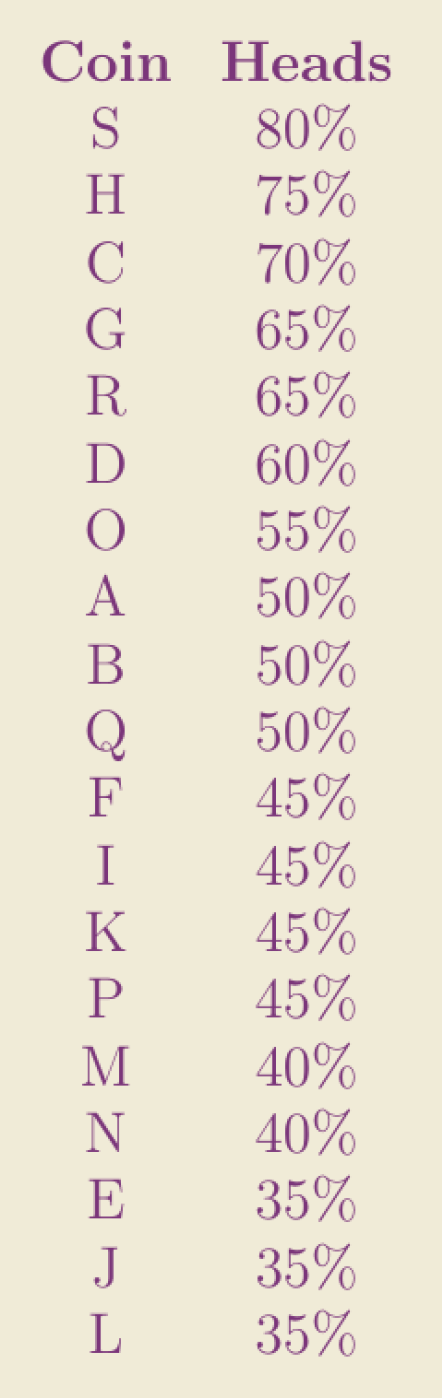
Is coin S really good at flipping heads while coins E, J, and L are instead good at flipping tails?
While it's tempting to think 20 coin tosses should result in 10 heads and 10 tails like with coins A, B, and Q, that's not how things tend to work in practice. Typically you'll get more heads or more tails. Very rarely, you might even see 19 or 20 heads or tails in a row!
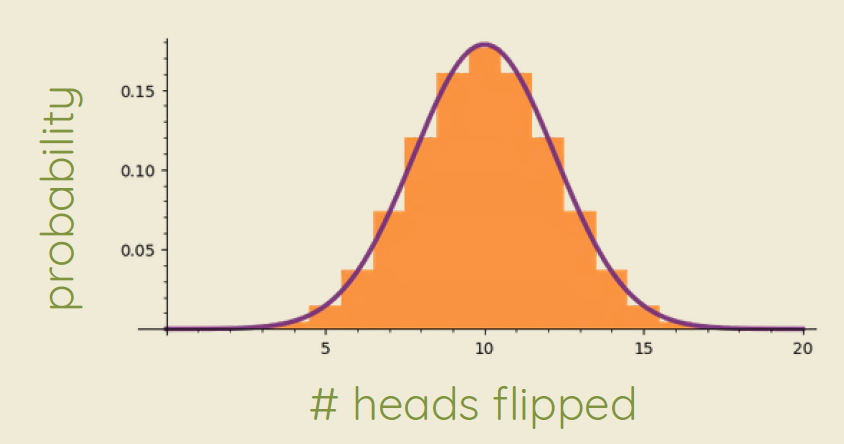
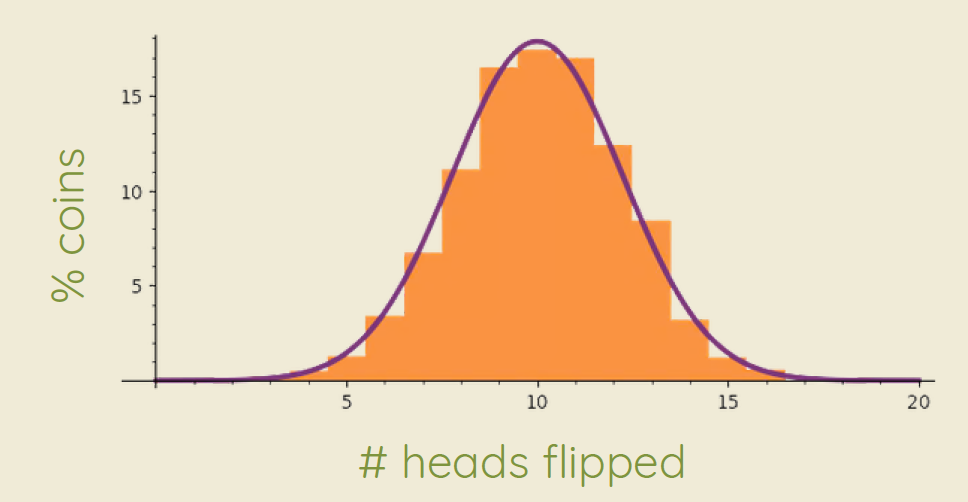
Coin flip tallies follow a binomial distribution. With enough coins, the central limit theorem tells us heads counts should approximate a normal distribution.
Here's what the probability distribution for 20 flips looks like in orange, with the approximated normal distribution in purple:
Here's how our "groundhog" predictions and coin flip experiment look, with that same normal distribution curve for comparison:

We don't get many data points from 19 coins or groundhogs, so it's not surprising that the normal curve approximations are rough, but here's what I got when I reran my simulation with 1000 coins:
A thousand groundhogs would likely yield a prediction distribution like the one above. With enough groundhogs, we'd likely also find one predicting with 100% accuracy – not due to "skill," but because that's just how the numbers crunch!
How else can math help us interpret predictions?