Math in… Vector Graphics
Image files like .JPEGs, .GIFs, .PNGs, and .BMPs are raster graphics. This means they’re encoded to have pixel arrays of exactly specified dimensions. For images like these, if you zoom in far enough, your image can look blurry or blocky, depending on how your graphics application fills in the gaps.
Some images — like company logos and letters in fonts — need to look sharp and clear, no matter how much you zoom in or out. Since nobody wants to redesign these images for every possible size, these graphics are stored differently.
Image files like .SVGs, .EPSs, and .WMFs are vector graphics. Instead of using a pixel grid, these file formats store instructions that tell your computer how to draw the shapes and fill them in. Since these instructions use mathematical formulas, they can be resized to work at any scale without losing quality.
Note: at time of publishing, Squarespace does not offer an option for embedding vector graphics. Above is a rasterized version of a vector image.
One type of curve that are used often in vector graphics is called a Bézier (bay-zee-ay) curve. Different degrees of Bézier curves can make more complex instructions for your computer to follow.
Here are some common types of Bézier curves:
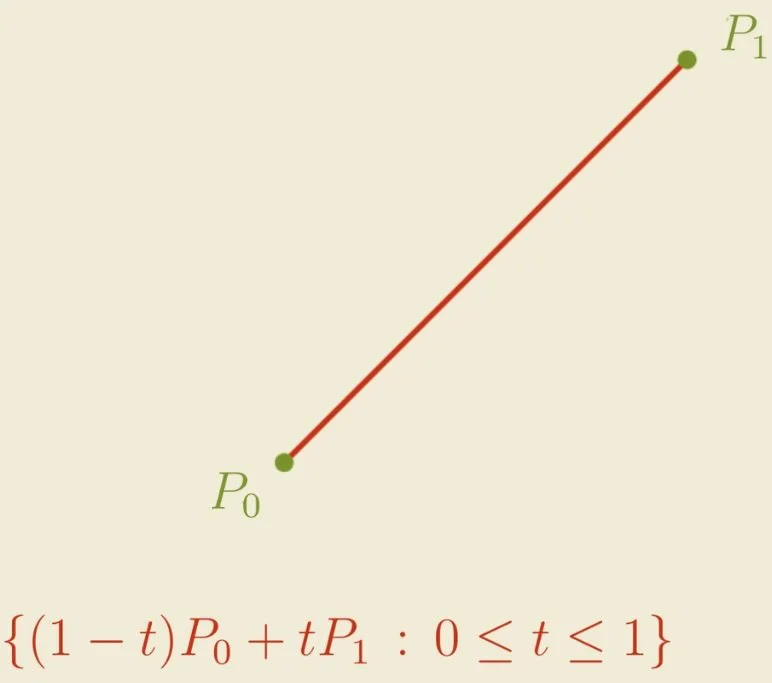
A degree-1 Bézier curve is simply a straight line. You only need to know the endpoints, and the computer will fill in the line in between.
A degree-2 Bézier curve is a quadratic segment that forms a curve. To store it as data, you need to know the two endpoints, plus one point that helps shape the curve.
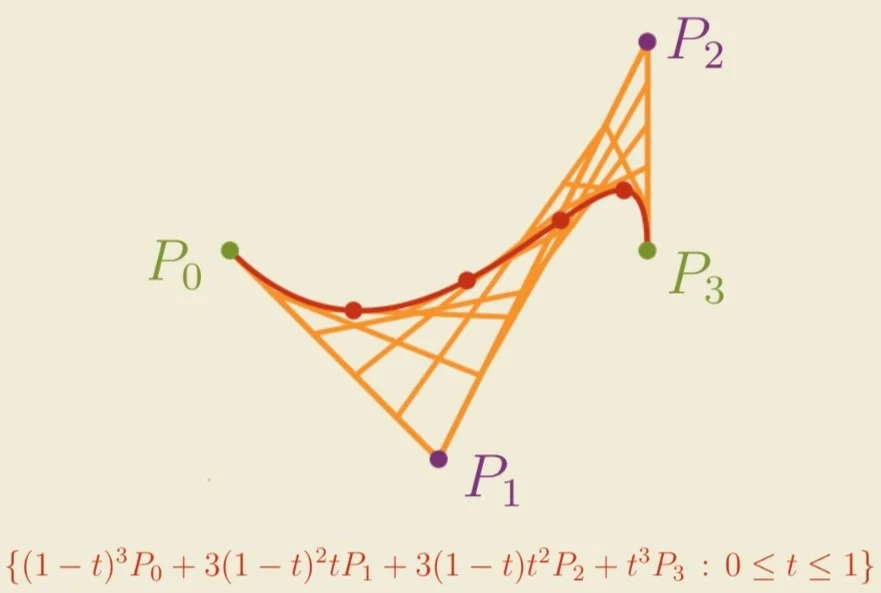
A degree-3 Bézier curve is a cubic segment. You need to know the two endpoints, plus two points that can shape the curve in different ways.
While you can make even more complex curves, connecting Bézier curves of degree-3 or less is usually all you need to create lines and shapes in logos, type, and other vector graphics.
These mathematical curves can easily be moved, resized, rotated, flipped, and transformed in other ways. When you’ve finished the formulas, computers can turn these vector graphics into raster graphics. This is how text and logos look just as great on a huge billboard as they do on a tiny business card!
If you could design a logo for any brand, what would it be and why?


